Connecting Synaptic Gene Polymorphisms to Parkinson’s Disease

alt="synapse"

Neurodegenerative disorders represent a significant and growing concern in the realm of public health, particularly as global populations age. Among these, Parkinson’s disease (PD) stands out due to its increasing prevalence and profound impact on individuals. Characterized by the progressive degeneration of motor functions, PD is not just a health challenge but also poses substantial socio-economic burdens. While the etiology of Parkinson’s disease is far from simple, current research efforts elucidating its causes, mechanisms, and potential treatments illustrate the critical nature of this neurodegenerative disorder in today’s healthcare landscape.

In the clinic, Parkinson’s disease is often diagnosed as either sporadic or familial. Familial PD has a clear genetic basis, typically passed down through families, while sporadic PD, comprising about 90% of cases, occurs in individuals without a known family history of the disease. The exact cause of sporadic PD is not fully understood but is believed to be due to a combination of genetic predispositions and environmental factors. In contrast, the factors involved in familial PD are more thoroughly understood, offering insights into the molecular mechanisms underlying PD pathogenesis.

Polymorphisms and Parkinson’s Disease Susceptibility

Continue reading “Connecting Synaptic Gene Polymorphisms to Parkinson’s Disease”

Cell-Based Target Engagement and Functional Assays for NLRP3 Inhibitor Profiling Help Identify Successes and Failures

Identifying Inflammasome Inhibitors: What’s Missing
The NLRP3 inflammasome is implicated in a wide range of diseases. The ability to inhibit this protein complex could provide more precise, targeted relief to inflammatory disease sufferers than current broad-spectrum anti-inflammatory compounds, potentially without side effects.

Studies of NLRP3 inflammasome inhibitors have relied on cell-free assays using purified NLRP3. But cell-free assays cannot assess physical engagement of the inhibitor and target in the cellular micro-environment. Cell-free assays cannot show if an NLRP3 inhibitor enters the cell, binds the target and how long the inhibitor binding lasts.

Cell-based assays that interrogate the physical interaction of the NLRP3 target and inhibitor inside cells are needed.

Continue reading “Cell-Based Target Engagement and Functional Assays for NLRP3 Inhibitor Profiling Help Identify Successes and Failures”

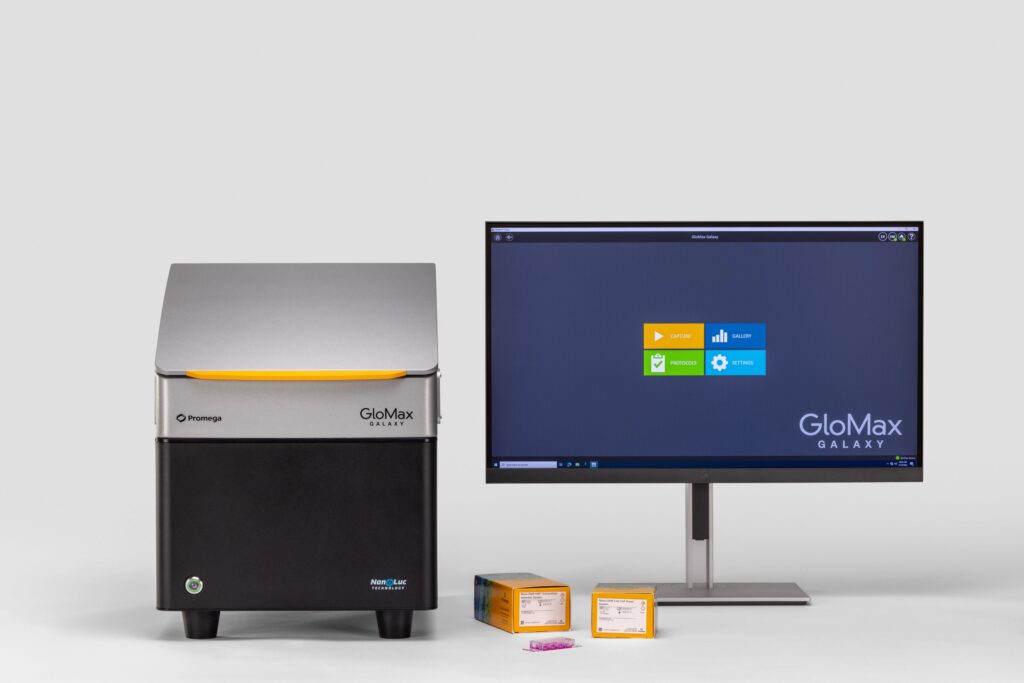
Scaling Up to Measure 40,000 Data Points a Day with GloMax® Microplate Readers

Traditional approaches for protein degrader compound screening like Western blotting can be laborious, time consuming and cannot be streamlined with automation. By implementing a high-throughput, automated workflow that uses our CRISPER/Cas9 knock-in cell lines, live-cell bioluminescent assays and sensitive GloMax® Discover microplate readers, our custom assay services offer protein degradation profiling at an accelerated rate.  

To do this, we collaborated with HighRes® Biosolutions, to develop an automated system that can screen up to 100 384-well plates each day, generating roughly 40,000 data points with minimal hands-on work.

Learn how bioluminescent tools like HiBiT and NanoBRET™ technology can help you answer key questions in your targeted protein degradation research.

An important step of building this system is to integrate four GloMax® Discover microplate readers into the automated system using instrument’s built-in SiLA2 communication driver. The driver software makes it easy to connect the microplate readers with HighRes® Biosolution’s robotic components.

Check out our setup in the video below.

See how we’ve integrated GloMax® Discover microplate readers into a high-throughput automated system for profiling protein degraders in live cells.
Continue reading “Scaling Up to Measure 40,000 Data Points a Day with GloMax® Microplate Readers”

Save Precious Time with Same-Well Multiplexing

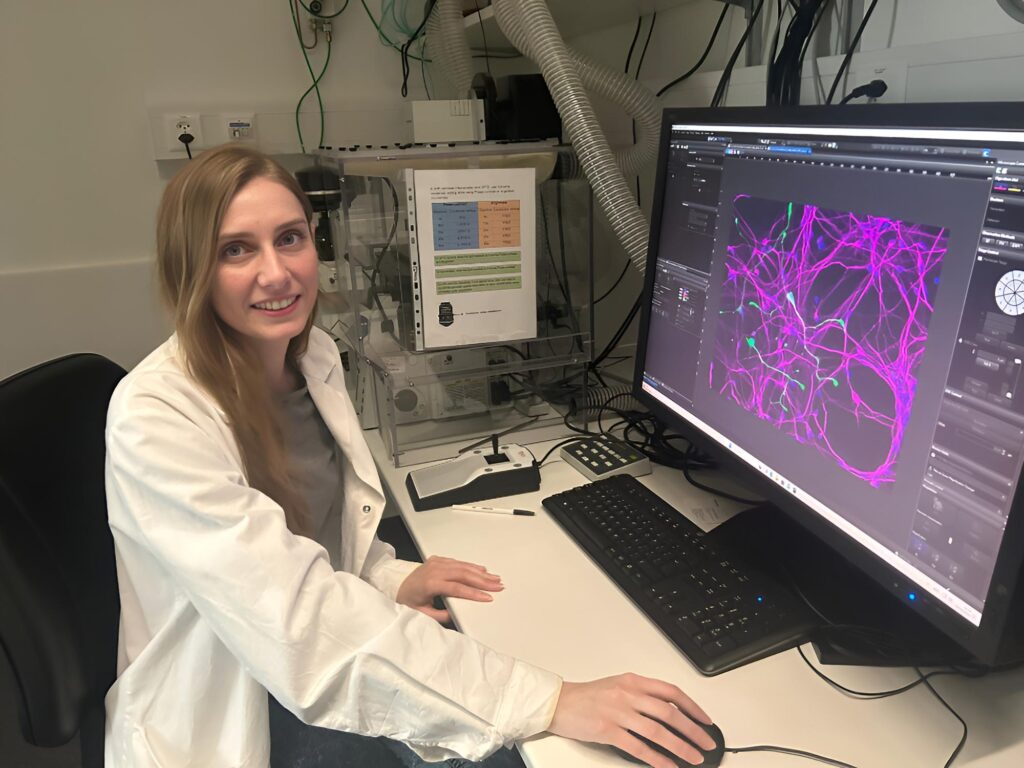
Scientist performing a multi-well assay. Same-well multiplexing enables you to look at one event from several perspectives.

A graduate student believes he has mastered the art of “the assay”. No need to run duplicates, he knows exactly which one will get him the answers he needs right away.  

To challenge this, his PI proposes an exercise. He asks of the graduate student, “What happens when you treat cells with doxorubicin?”

The graduate student raises his cells, treats them accordingly, and decides to run a cell viability assay to determine their fate. He returns to the PI with the final verdict: his cells are dead.

The PI takes a look at the data and asks the graduate student to repeat the experiment with an additional assay for cytotoxicity―but the cytotoxicity assay shows that the cell membranes are intact, which only puzzles the graduate student. The PI asks him to run a third assay for apoptosis, and when the student does so, it becomes clear that the cells are dying.

The PI uses this opportunity to make his point: “Now do you see why I ask for more than one assay?”

Continue reading “Save Precious Time with Same-Well Multiplexing”

3D Cell Culture Models: Challenges for Cell-Based Assays

3D Cell Culture Spheroid

In 3D cell culture models, cells are grown under conditions that allow the formation of multicellular spheroids or microtissues. Instead of growing in a monolayer on a plate surface, cells in 3D culture grow within a support matrix that allows them to interact with each other, forming cell:cell connections and creating an environment that mimics the situation in the body more closely than traditional 2D systems. Although 3D cultures are designed to offer a more physiologically accurate environment, the added complexity of that environment can also present challenges to experimental design when performing cell-based assays. For example, it can be a challenge for assay reagents to penetrate to the center of larger microtissues and for lytic assays to disrupt all cells within the 3D system.

Earlier this week Terry Riss, a Senior Product Specialist at Promega, presented a Webinar on the challenges of performing cell-based assays on microtissues in 3D cell culture. During the Webinar, Terry gave an overview of the different methods available for 3D cell culture, providing a description of the advantages of each. He then discussed considerations for designing and optimizing cell-based  assays for use in 3D culture systems, providing several  recommendations to keep in mind when performing cell viability assays on larger microtissue samples.

Continue reading “3D Cell Culture Models: Challenges for Cell-Based Assays”

Maximize Your Time in the Lab: Improve Experimental Reproducibility with Thaw-and-Use Cells

Many cell biology researchers can name their department’s  or institutions’s “cell culture wizard”—the technician with 20+ years of experience whose cell cultures are always free from contamination, exhibit reliable doubling rates and show no phenotype or genotype weirdness. Cell culture takes skill and experience. Primary cell culture can be even more difficult still, and many research and pharmaceutical applications require primary cells.

Yet, among the many causes of failure to replicate study results, variability in cell culture stands out (1). Add to the normal challenges of cell culture a pandemic that shut down cell culture facilities and still limits when and how often researchers can monitor their cell culture lines, and the problem of cell culture variability is magnified further.

Treating Cells as Reagents

A good way to reduce variability in cell-based studies is to use the thaw-and-use frozen stock approach. This involves freezing a large batch of “stock” cells, then performing quality control tests to ensure they respond appropriately to treatment. Then whenever you need to perform an assay, just thaw another vial of cells from that batch and begin your assay—just like an assay reagent! This approach eliminates the need to grow your cells to a specific stage, which could take days and introduce more variability.

Continue reading “Maximize Your Time in the Lab: Improve Experimental Reproducibility with Thaw-and-Use Cells”

Why You Don’t Need to Select a Wavelength for a Luciferase Assay

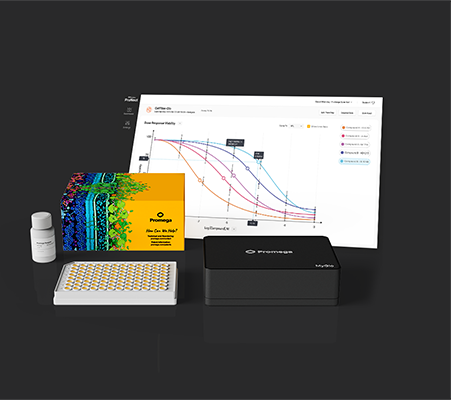
Promega kit depicted; test involves wavelength for a luciferase assay.

It’s a question I’m asked probably once a week. “What wavelength do I select on my luminometer when performing a luciferase assay?” The question is a good and not altogether unexpected one, especially for those new to bioluminescent assays. The answer is that in most cases, you don’t and in fact shouldn’t select a wavelength (the exception to this rule is if you’re measuring light emitted in two simultaneous luciferase reactions). To understand why requires a bit of an explanation of absorbance, fluorescence, and luminescence assays, and the differences among them.

Absorbance, fluorescence, and luminescence assays are all means to quantify something of interest, be that a genetic reporter, cell viability, cytotoxicity, apoptosis, or other markers. In principle, they are all similar. For example, a genetic reporter assay is an indicator of gene expression. The promoter of a gene of interest can be cloned upstream of a reporter such as β-galactosidase, GFP, or firefly luciferase. The amount of each of these reporters that is transcribed into mRNA and translated into protein by the cell is indicative of the endogenous expression of the gene of interest.

Continue reading “Why You Don’t Need to Select a Wavelength for a Luciferase Assay”

Eight Considerations for Getting the Best Data from Your Luminescent Assays

The stage is set. You’ve spent days setting up this experiment. Your bench is spotless. All the materials you need to finally collect data are laid neatly before you. You fetch your cells from the incubator, add your detection reagents, and carefully slide the assay plate into the luminometer. It whirs and buzzes, and data begin to appear on the computer screen. But wait!

Bad data
These data are garbage!

Don’t let this dramatic person be you. Here are 8 tips from us on things to watch out for before you start your next luminescent assay. Make sure you’ll be getting good data before wasting precious sample!

Continue reading “Eight Considerations for Getting the Best Data from Your Luminescent Assays”

A BiT or BRET, Which is Better?

Now that Promega is expanding its offerings of options for examining live-cell protein interactions or quantitation at endogenous protein expression levels, we in Technical Services are getting the question about which option is better. The answer is, as with many assays… it depends! First let’s talk about what are the NanoBiT and NanoBRET technologies, and then we will provide some similarities and differences to help you choose the assay that best suits your individual needs. Continue reading “A BiT or BRET, Which is Better?”

Executing a NanoBRET™ Experiment: From Start to Data

This is a guest post from Katarzyna Dubiel, marketing intern in Cellular Analysis and Proteomics.

“The objective of my experiment was to test the NanoBRET™ assay as if I was a customer, independent of the research and development team which develops the assay.”

Designing and implementing a new assay can be a challenging process with many unexpected troubleshooting steps. We wanted to know what major snags a scientist new to the NanoBRET™ Assay would encounter. To determine this, we reached out to Laurence Delauriere, a senior applications scientist at Promega-France, who had never previously performed a NanoBRET™ assay. Laurence went step-by-step through the experimental process looking at the CRAF-BRAF interaction in multiple cell lines. In an interview, Laurence provided us with some tips and insights from her work implementing the new NanoBRET™ assay.

In a few words, can you explain NanoBRET?
“NanoBRET is used to monitor protein: protein interactions in live cells. It is a bioluminescence resonance energy transfer (BRET) based assay that uses NanoLuc® luciferase as the BRET energy donor and HaloTag® protein labeled with the HaloTag® NanoBRET™ 618 fluorescent ligand as the energy acceptor to measure the interaction of two binding partners.” Continue reading “Executing a NanoBRET™ Experiment: From Start to Data”