This blog was contributed by guest Avi Aggarwal, 2025 summer intern at Promega.
If you’ve ever scratched your head over inconsistent experimental results, especially ones that seem to fluctuate for no obvious reason—you’re not alone. Sometimes the problem isn’t your pipetting, your reagents, or even your protocol. It might be the room itself.
Changes in temperature, humidity, or even invisible dust particles can quietly throw off your results. Something as simple as moving your thermocycler under an air vent or setting up a plate reader where sunlight hits it in the afternoon could cause subtle but significant issues.
Our Project to Learn How Subtle Environmental Changes Can Affect Sensitive Lab Equipment
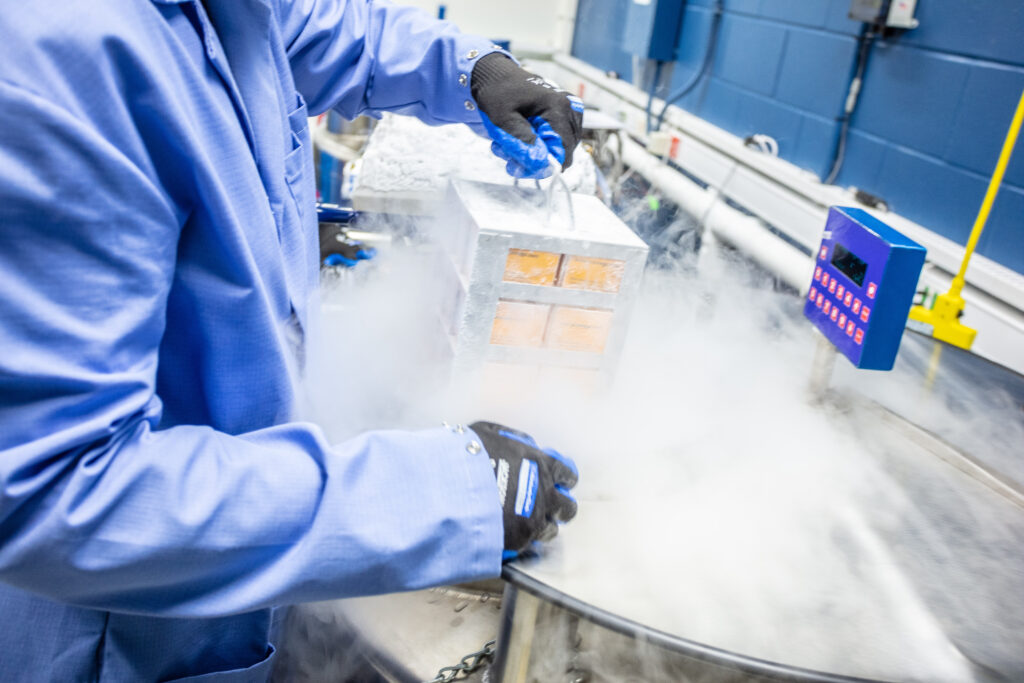
We spent some time developing an environmental anomaly detection framework aimed at helping scientists understand how subtle environmental changes can affect sensitive lab equipment and experimental results. Our team set out to monitor real-world lab conditions using temperature and humidity sensors, including live testing with a GloMax® Discover platform and Sensirion SHT45 sensors. We also worked with open-source environmental datasets to simulate a variety of lab-like conditions, such as daily cycles, sudden temperature spikes, and slow humidity drifts.
With this data in hand, we tested and compared different anomaly detection techniques to see which ones best captured the types of changes that often go unnoticed—but can cause major variability in results. We evaluated methods individually and in combination, and developed automated ways to tune the models so they could be adapted easily to different lab environments. The goal? Build a flexible, real-time monitoring system that any scientist—not just data specialists—could use to spot problems before they lead to inconsistent or irreproducible data.
Let’s walk through a framework that helps you detect these environmental anomalies before they sabotage your work.
Where Should You Start When Looking at Environmental Factors That Might Be Influencing Your Data?
Start by monitoring basic environmental conditions—temperature and humidity are two of the most common culprits. These variables can fluctuate throughout the day or change gradually over time. Some questions to ask:
- Does your equipment sit under or near a vent, window, or radiator?
- Are certain results more variable at certain times of day?
- Have you recently moved or reconfigured your lab setup?
To understand whether your environment is affecting your data, you need to track it over time. Small environmental changes might not be visible to the naked eye, but sensors can help collect the data you need.
How Can You Detect Environmental Changes That Might Affect Your Experiments?
You don’t need to be a data scientist to start identifying unusual trends. We explored a few analytical methods that are surprisingly straightforward and useful, even for non-experts.
Z-Score Detection
A Z-score tells you how far a data point is from the average. If it’s more than 3 standard deviations from the mean, we flagged it as an “anomaly.”
- Great for: Spotting sudden temperature or humidity spikes (e.g., when someone opens a door and lets in cold air).
- Limitations: Not ideal for slow or seasonal shifts.
CUSUM (Cumulative Sum)
This method looks for gradual trends by tracking how data deviates over time.
- Great for: Detecting a slow change in temperature over several hours.
- Limitations: Needs careful threshold tuning to avoid false alarms.
Holt-Winters Seasonal Model
This technique breaks data down into parts: average level, trends, and regular repeating patterns (like daily temperature cycles).
- Great for: Catching subtle deviations during predictable temperature or humidity cycles.
- Limitations: You’ll need a bit of baseline data for it to learn the patterns.
Using all three of these methods together gives you a stronger safety net—they each catch different types of issues.
Do You Need to Manually Set Threshold Parameters?
Nope. A big win from this project was automating the tuning process for all three methods using baseline data. Depending on the lab, a couple of high-level adjustments are presented instead:
- Z-Score: You can choose either a stricter percentile-based approach or a looser 4-sigma limit.
- CUSUM: Set thresholds to the top 3–5% of data.
- Holt-Winters: Baseline slack can be set to 2 or 3 standard deviations.
That means less guesswork and more reliable detection without a one-size-fits-all approach.
What If Multiple Factors Are Changing at Once?
In real life, temperature and humidity often change together. If you’re only looking at them separately, you might miss some anomalous conditions where one influences the other. To detect complex changes, we explored several multivariate anomaly detection methods that consider multiple factors at once. Different multivariate techniques excel at picking up on differing inter-variable relationships. In general, these are more challenging mathematically than univariate methods. Selecting correct thresholds is also more involved when using these methods.
By combining various multivariate techniques, you get a more complete picture—whether it’s a predictable drift or an unexpected spike, you’ll see it coming.
What’s the Bottom Line?
Environmental conditions can quietly undermine your experiments, but you don’t have to be an engineer to catch them. By:
- Tracking environmental data (like temp and humidity),
- Applying a few smart analysis techniques (Z-score, CUSUM, Holt-Winters),
- And combining multiple tools when things get complex (PCA, K-means, Isolation Forest),
…you can build a simple but powerful system to spot issues before they affect your results.
This kind of awareness and troubleshooting can save you time, preserve your samples, and improve the reproducibility of your work. That’s a win in any lab.
Want to Try This Yourself?
- We tested our methods using free datasets from Colombia and Bristol.
- Live testing was done using a Promega GloMax® Discover System and a Sensirion SHT45 sensor to collect humidity and temperature data.
You can do this with a basic sensor and a little bit of code. Or just partner with someone in your lab or IT group who loves digging into data—you’ll both learn something useful.
Latest posts by Promega (see all)
- Measure Engagement to Target Proteins within Complexes: Why Context Matters - October 9, 2025
- Cellular Selectivity Profiling: Unveiling Novel Interactions and More Accurate Compound Specificity - September 11, 2025
- Is Your Lab Environment Messing with Your Results? How to Spot the Signs Early - September 9, 2025