Robert Hooke first coined the term “cell” after observing plant cell walls through a light microscope—little empty chambers, fixed in time and space. However, cells are anything but fixed.
Cells are dynamic: continually responding to a shifting context of time, environment, and signals from within and without. Interactions between the macromolecules within cells, including proteins, are ever changing—with complexes forming, breaking up, and reforming in new ways. These interactions provide a temporal and special framework for the work of the cell, controlling gene expression, protein production, growth, cell division and cell death.
Visualizing and measuring protein:protein interactions at the level of the cell without perturbing them is the goal of every cell biologist.
A recent article by Thomas Machleidt et al. published in ACS Chemical Biology, describes a new technology that brings us closer to being able to realize that goal.
Resonance Energy Transfer
BRET (bioluminescence resonance energy transfer) has been applied to studies of protein interactions in cells for over 15 years. It takes advantage of the principle of resonance energy transfer, which refers to the transfer of excited state energy from one molecule to another when they are very close (within ~5nm) to one another.
The first techniques to exploit resonance energy transfer for investigating biological systems involved transfer between two fluorophores (FRET—fluorescence energy transfer), but this technique had many limitations including the need to excite the donor with an external light source. BRET improved upon FRET by using a bioluminescent donor—the energy being supplied by a chemical reaction, rather than an external light source. However BRET was still limited by a lack of sensitivity and dynamic range.
NanoBRET™ Technology
The most commonly used BRET method (BRET1) relies on an engineered luciferase from sea pansy (Renilla luciferase), Rluc8, which can provide higher light intensity than traditional luciferase donors, matched with Yellow Fluorescent Protein (YFP). BRET1 has a fairly high background because of the spectral proximity of Rluc8 and YFP. The background from this spectral “overlap” reduces the sensitivity and dynamic range of the BRET1 assay.
NanoLuc® Luciferase (Nluc) is a very small (19 KDa) protein that is physically very stable and produces an extremely bright signal. Additionally, it has a narrower spectrum than Rluc8, allowing it to be matched with acceptors that have greater spectral separation, reducing assay background and therefore increasing sensitivity and dynamic range.
In this paper, the authors describe experiments to determine the best acceptor match possible for the Nluc donor. They used HaloTag® Technology to find their acceptor fluorophore. HaloTag® Technology consists of a protein tag that covalently binds a chloroalkane tag that can be chemically coupled to fluorophores or other molecules.
To find the best acceptor match, the Malcheit et al., created a HaloTag-NanoLuc fusion protein (Nluc-HT) and tested 57 chloroalkane flurophore conjugates. The best match for Nluc was a long wavelength fluorophore, non-chloro TOM (NCT) dye, which has a peak light emission of 635nm. That provided a spectral separation of 175nm, reducing background between donor and acceptor.
Evaluating NanoBRET™ Performance
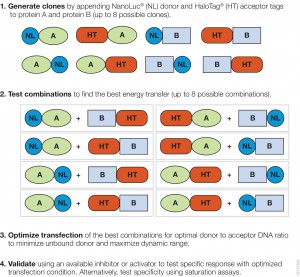
The authors used the rapamycin-induced interaction of FKBP12 with Frb (rapamycin domain of mTOR) to compare the performance of the NanoBRET™ (Nluc/HT-NCT ) with BRET1 (Rluc8/YFP). mTOR (mammalian Target of Rapamycin) is a PI3 kinase involved in many key cell signaling cascades, and the interactions of the Frb with FKBP12 has been well characterized. The authors created all eight possible configurations, (donor and exceptor fused to the N and the C termini of the interacting proteins) for both the NanoBRET and the BRET1 experimental systems because energy transfer between donor and acceptor can be affected by the geometry of the molecules.
Higher, More Stable Signal
For all 8 configurations, in both systems, induction by rapamycin led to energy transfer from donor to acceptor. However, the NanoBRET™ system yielded consistently higher signal than the BRET1 system. Additionally the NanoBRET™ measurement remained relatively constant for nearly an hour, indicating that the NanoBRET™ system would be useful for characterizing protein:protein interactions (PPI) over time.
Better Performance at Physiologically Relevant Concentrations
To truly understand the cell, we must be able to observe it with out perturbing it. One problem with expressing non-native reporters and fusion proteins is that high expression levels of these proteins can lead to artifacts because they disrupt normal cellular function and normal protein interactions.
The authors of this paper wanted to see how both NanoBRET™ and BRET1 performed at low expression levels. To do this they measured rapamycin-induced BRET over a series of concentrations of donor/acceptor expression plasmids that had been diluted with carrier DNA. Although lowering concentrations adversely affected rapamycin-induced BRET response, they found that the NanoBRET™ system provided relevant data for the entire range of dilutions. When the authors evaluated their data using Z-factor analysis, a statistical measure of data variability and dynamic range, they found that the NanoBRET™ system maintained sensitivity, even at concentrations of FKBP-HT below levels of endogenous FKBP.
Cellular Imaging with BRET
Traditionally bioluminescence has not been particularly useful for cellular imaging. However, the bright luminescence of Nluc combined with improvements in imaging make cellular imaging with NanoBRET™ possible. In this paper the authors show that they could follow the ligand-induced recruitment of ß-arrestin 2 to the vasopressin receptor 2.
In a series of micrographs, the authors demonstrated that in the absence of ligand, Nluc-ß-arrestin 2 was uniformly distributed throughout cells. However when ligand was added, a vesicular pattern appeared in both the donor and acceptor channels, indicating the association of the two proteins. The authors were also able to apply NanoBRET™ imaging to their FKBP/Frb model system .
Conclusion
BRET has always been a powerful tool for revealing PPI in cells. With the improvements in sensitivity and dynamic range of the NanoBRET™ system, we now have the ability to get more biologically relevant data by looking at low-expression regulatory proteins and other interactions that occur at low levels. Additionally, these protein associations can actually be visualized, adding an entirely new dimension and understanding to the nature of the dynamic interactions within cells.
Reference
Machleidt, T. et al. (2015) NanoBRET—A novel BRET platform for the analysis of protein-protein interactions. ACS Chemical Biology.