How Confident are You in Your Mass Spectrometry Data?

Data generated by scientific instruments and decisions based on that data depend on optimal instrument performance. Clinical assays rely on mass spectrometric (MS) data for accurate results so that correct health related results are gained and appropriate results-based decisions are made. However, there are no generally agreed upon tools nor performance standards for mass spectrometry. Furthermore, while several software tools exist that serve to assist  with the analysis of instrument performance, a dedicated reagent software package has yet to be created. For optimal liquid chromatography (LC) performance, parameters like retention time, peak width and peak heightare typically reported. Commonly monitored MS parameters include mass accuracy, mass resolution, signal-to noise, sensitivity, limit of detection (LOD), limit of quantitation (LOQ) and dynamic range.

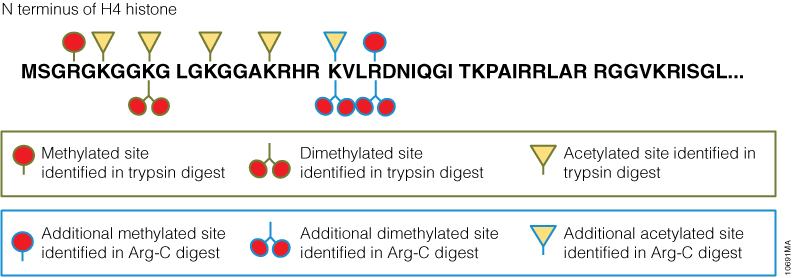
The 6 × 5 LC-MS/MS Peptide Reference Mix is designed for use in method development and optimization,and for routine liquid chromatography (LC) and mass spectrometry (MS) instrument performance monitoring. The product is a mixture of 30 peptides: 6 sets of 5 isotopologues of the same peptide sequence. The isotopologues (Figure 1) differ only by the number of stable, heavy-labeled amino acids incorporated into the sequence. The labeled amino acids consist of uniform 13C and 15N atoms. Each of the isotopologues is indistinguishable chemically and chromatographically. However, since they differ in mass, they are clearly resolved by mass spectrometry.

Figure 1.
Figure 1.

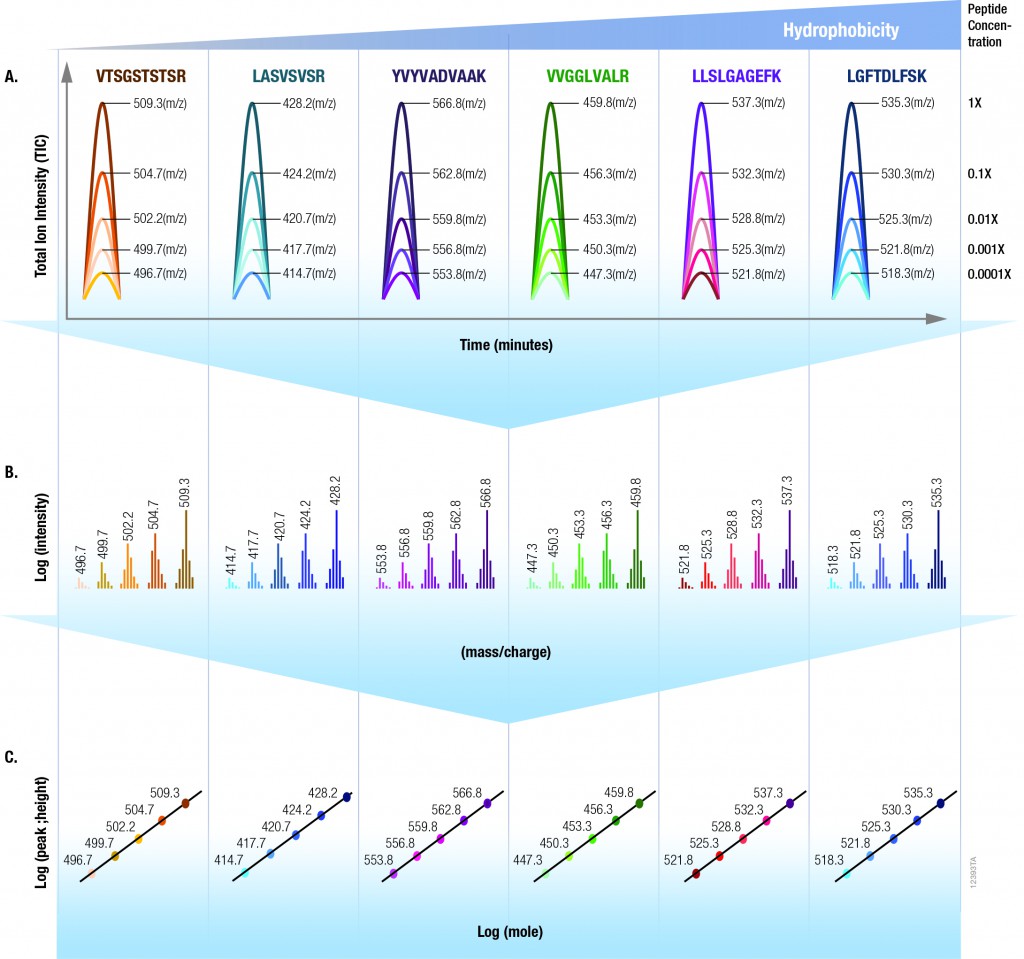
The isotopologues of each peptide are present in a series of tenfold differences in concentration or molar abundance. If 1pmol of the mixture is loaded onto an LC column, the next lighter isotopologue would be 100fmol, the next 10fmol, the second lightest 1fmol, and the lightest 100amol. This range allows assessment of the instrument’s dynamic range and sensitivity from a single run.

Peptides with a wide range of hydrophobicities were chosen to enable reporting of LC column performance. The most hydrophilic peptide gives users a tool to optimize the capture of hydrophilic peptides that might be difficult to capture otherwise, but that are too precious to use for method development.

To assist in data processing, a complementary software tool, is provided, the 6 × 5 LC-MS/MS Peptide Reference Mix Analysis Software (The PReMiS™ Software). The PReMiS™ Software produces a tabular report of calculated instrument parameters, graphical analysis of linearity curves as well as reporting the history of user-selected parameters such as LC retention time, peak height and mass accuracy. If the laboratory has a collection of instruments, there is also an option to compare parameters across instruments.

Enhancing Proteomics Data Using Arg-C Protease

Arg-C (clostripain), Sequencing Grade (Cat.# V1881), is a specific endoproteinase isolated from the soil bacterium Clostridium histolyticum. It preferentially cleaves at the C-terminal side of arginine (R) residues. Unlike trypsin, Arg-C efficiently cleaves arginine sites followed by proline (P). This difference is important because every twentieth arginine is followed by proline. To illustrate this benefit, Arg-C was evaluated for protein analysis in two different experiments. In the first experiment, we studied the use of Arg-C for proteomic analysis. Yeast provides an excellent model proteome because its genome is well annotated. Yeast extract was digested in two parallel reactions, using trypsin in the first reaction and Arg-C in the second, using a conventional protocol consistent with LC-MS/MS analysis. As expected the trypsin digestion resulted in a high number of peptide and protein identifications (Figure 1). However, many peptides remained elusive. The parallel Arg-C digestion complemented the trypsin digestion by recovering an additional 2,653 peptides and providing a 37.4% increase in the number of identified peptides. Digesting with Arg-C also resulted in an increase in the number of identified proteins. In fact, 138 new proteins were identified in Arg-C digest compared to the parallel trypsin digest, offering a 13.4% increase in the overall number of identified proteins.

Figure 1. Side-by-side analysis of trypsin-digested and Arg-C digested yeast proteins.

Are you looking for proteases to use in your research?
Explore our portfolio of proteases today.

In a second experiment, the ability of Arg-C to analyze individual proteins was analyzed, selecting human histone H4 as a model protein. Like other histones, this protein is heavily modified post translational modifications (PTMs) that alter histone structure and regulate interaction with transcription factors. As a result, histone PTMs are implicated in gene regulation and associated with multiple disorders. Technical challenges, however, impede histone PTM analysis. Histone PTMs are complex and some, such as acetylation and methylation, prevent trypsin digestion, as shown by our data. In this experiment, trypsin digestion of histone H4 identified several PTMs (Figure 2). However, certain PTMs were missing. By digesting histone H4 with Arg-C, we were able to identify the missing PTMs including mono-, dimethylated and acetylated lysine and arginine residues. We speculate that the PTMs in human histone H4, which modified arginine and lysine residues, rendered trypsin unsuitable for preparing the corresponding histone regions for mass spectrometry. The problem was rectified by replacing trypsin with Arg-C.

Figure 2. Identification of histone h4 PTMs after Arg-C digestion.